Spencer Stuart’s recently-released and always highly-anticipated annual Board Index reveals a treasure trove of benchmarking data for the S&P 500 on numerous aspects of board composition-related, board organization and process-related practices, and director compensation practices - including a focused review on particular hot topics including board renewal and cybersecurity oversight.
Although just one of numerous key benchmarking areas, this data on new director (including first-time director) appointments is particularly noteworthy in view of the current intense focus on board composition and refreshment:
New Director Pool Illustrates Focus on Board Refreshment
- 397 new independent directors - up 15% from 2016 and the most since 2004.
- 52% of boards appointed at least one new director; 20% appointed more than one.
- Of the 189 boards disclosing the source of director candidates, 11% reported that the nominees were recommended by shareholders - up from 1% a decade ago.
- 19% of new directors have tech or telecommunications backgrounds.
New Director Pool Illustrates Focus on Board Diversity
- Female representation among new directors increased to 36% in 2017 - the highest rate since Spencer Stuart began tracking this data in 1998.
- 20% are minorities - defined as African-American, Hispanic/Latino or Asian (including Indian descent - consistent with US Census Bureau methodology).
- Eliminating overlap of directors who are both women and minorities, just over 50% of new directors are female or minority directors - up from 42% last year.
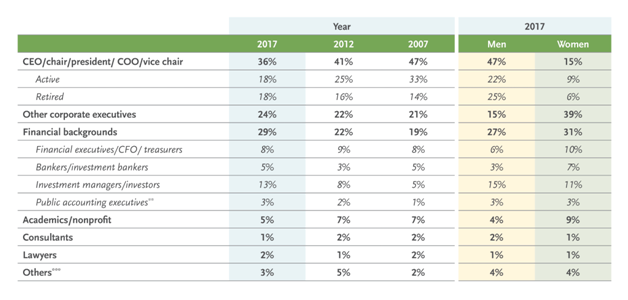
- New female independent directors are more likely than new male independent directors to be line and functional leaders - 23% of women compared with 10% of male directors. Another 16% of female directors are division or subsidiary presidents vs. 5% of male directors. In contrast, male directors are significantly more likely than female directors to be active or retired CEOs, chairs, presidents or COOs: 47% vs. 15%.
 First-Time Directors Further Illustrate Expanding Candidate Pool
- 45% of the new directors are first-time independent directors serving on their first public company board - up from 32% last year.
- 64% of first-time directors are actively employed, compared with 42% of experienced directors.
- First-time directors average 55.2 years of age, compared with 57.3 for all new directors.
- 42% of first-time directors are women, compared to 32% in 2016.
- 21% of first-time directors are minorities, up from 10% last year.
- Eliminating overlap, 55% of first-time directors are female or minorities or both - up from 37% last year.
- First-time directors are more likely than new directors with previous board experience to be current or former division or subsidiary leaders or functional leaders - but less likely to be CEOs, chairs, presidents or chief operating officers.
NEW INDEPENDENT DIRECTOR FUNCTIONAL BACKGROUNDS*
 N = 255 men and 142 women in 2017
*Except where noted, all include both active and retired executives. **All former partners or executives of public accounting firms. ***Includes former government employees, medical executives, a real estate broker, a sports/entertainment agent, among others.
As an alternative or in addition to the full report, explore your particular areas of interest online: