“What’s ESG Got To Do With It? The Current State of U.S. Sustainability Reporting” from Teneo includes a treasure trove of benchmarking data on the form and content of S&P 500 sustainability reports based on its analysis of 200 reports across sectors published between January 1 – June 30, 2022, covering the company’s prior fiscal year.
Among the key takeaways:
Form
- Report title—Nearly two-thirds of reports include either Environmental, Social & Governance/ESG (33%) or Sustainability (31%) in the title.
- Length—The average report length was 77 pages. Larger companies averaged 100+ pages.
- Summary—More than one-quarter provided a summary or highlights report (see Mondelez report, p.10).
- Data tables—More than two-thirds of reports included a table with key data (see Qualcomm report, p.38).
- Press release—A majority of companies issued a press release announcing their report.
- Timing—Most companies issued their report within 4-6 months of their fiscal year end. A plurality of companies published in April.
- Format—The vast majority of reports were made available in a pdf format; more than one-quarter of companies hosted interactive ESG microsites on their corporate website.
Content
- Letter from the CEO or board—Nearly 80% of reports included a CEO letter, while 10% included both a CEO and board letter.
- Internal oversight—Most reports described a cross-functional team approach to managing sustainability (see Coca-Cola report, p.17); 72% of reports also identified the executive with primary responsibility for sustainability.
- Board oversight— Most reports described how the board allocates ESG oversight responsibility (see Dow Chemicals report, p.76). Nearly half task the Nominating/Governance committee with primary oversight. More than one-quarter of reports mentioned a director with ESG credentials or expertise.
- Materiality assessment—Half of the reports disclosed having performed a formal materiality assessment to help determine ESG priorities; 41% included a materiality matrix in the report (see Cisco Systems webpage); and 34% included a disclaimer or qualifier on the use of the term “materiality” to distinguish from the use of that term for securities law purposes.
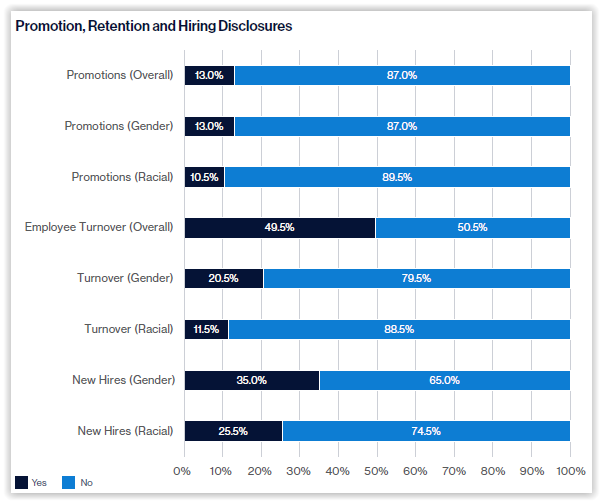
- DE&I—91% of reports disclosed employee demographic data and 85% included executive/senior level diversity data. Nearly half of reports disclosed overall employee turnover. More than one-quarter included data on new hires by race and 35% included data on new hires by gender. Nearly one-third of reports included employee pay gap data (as adjusted for comparability purposes).
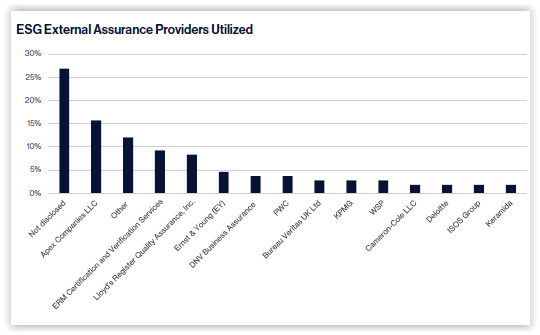
- External assurance—More than half disclosed third-party assurance of some data included in the report (51% environmental data only; 43% environmental and social data). A plurality of reports did not disclose the identity of the assurance provider. Of those that disclosed this information, Apex Companies was mentioned the most.
- Third-party disclosure frameworks—More than half of reports disclosed in at least partial alignment with SASB, GRI, UN SDG, and/or the TCFD, although SASB was the most heavily utilized by a large margin.
In addition to the informative benchmarking data, the report includes example disclosures throughout, and numerous insights and tips to enhance the readability and effectiveness of the report.
Access additional resources on our Sustainability page.