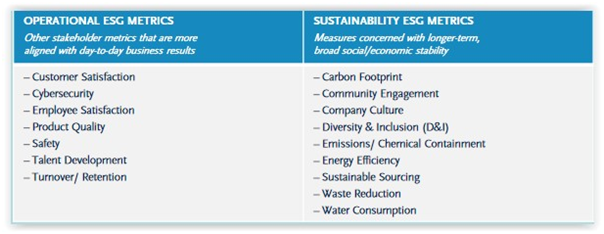
Semler Brossy's "ESG + Incentives 2021 Report" benchmarks across S&P 500 companies: (i) ESG incentive metrics by industry, (ii) (largely logical) variations across industry sectors (e.g., environmental and safety metrics concentrated among Energy, Utilities, and Materials sector companies), and (iii) rational decision-making by boards of directors in using metrics strategically to support or advance - rather than lead - corporate strategy. Metrics are broadly categorized as either “Operational” or “Sustainability” as detailed here:
 The report depicts the prevalence of each of the foregoing metrics by industry for all S&P 500 companies that use ESG metrics if the prevalence of the particular metric is at least 15% within that industry, accompanied by the names of companies within each industry whose incentive plans include these metrics.
See our recent report: “ESG Executive Compensation Metrics: Large Companies” and additional resources on our Executive Pay page »Non-Financial Metrics (Sustainability, DE&I, etc.) and Surveys/Studies.
This post first appeared in the weekly Society Alert!