Among the share-worthy takeaways from Spencer Stuart’s annual S&P 500 Board Index are these:
Demographics/Composition
- New director demographics—395 new independent directors were added over the past year to the 489 boards included in the 2022 index. Of those new directors, 72% are from historically underrepresented groups. Nearly half (46%) are Black or African American, Hispanic/Latino/a, Asian, American Indian or Alaska native, or multiracial, and 46% are women.
- All S&P 500 directors—Women represent 32% of all directors on these boards and 22% are racially/ethnically diverse.
- Diversity tactic—Notably, 83 boards increased their size to add racial/ethnic diversity (on a net basis after independent director departures). Of the 114 directors added to those boards, 77 were men and 37 were women.
- Diversity disclosure—LGBTQ+ disclosure was made in 15% of proxies (74 companies). Twenty-nine companies identified the LGBTQ+ status of individual directors; of those, 45 LGBTQ+ directors were disclosed: 27 unnamed and 18 named. Twenty-two companies disclosed military veterans on their boards. One company disclosed having a director with a disability.
- Industry backgrounds—The Technology, Consumer, and Financial Services sectors sourced the most new independent directors at 17%, 13%, and 12%, respectively.
- Global experience—Half of new directors have international experience (i.e., spent time working in a non-US location) compared to 34% last year.
Board refreshment practices
- Mandatory retirement—70% of boards have a mandatory retirement age, most commonly 75 and older.
- Term—Just 7% of boards (35 companies) have term limits, most commonly 15 years or more.
- Tenure—Most boards have an average tenure of between six and 10 years; the median independent director tenure is six years and the average is 7.8 years.
- Mandatory resignations—88% of boards require directors to offer their resignation upon a change in employment status or job responsibilities. Acceptance of the resignation is typically subject to the Nomination Committee Chair’s discretion.
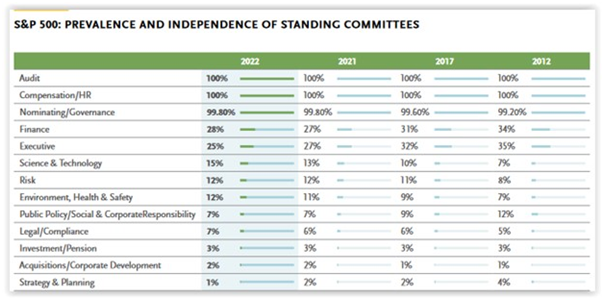
Standing committees
Always a topic of keen interest, here is the breakdown on board committee structures in 2022 as compared to 2021 and five and 10 years ago:
 Board evaluation practices
Among boards reporting some form of evaluation (98%):
- 47% reported evaluating the full board, board committees, and individual directors; 47% reported evaluating the full board and committees; 5% reported evaluating the full board only, and 1% reported evaluating the full board and directors.
- 25% of boards (compared to 20% last year) disclosed engagement of a third-party facilitator.
- A majority of companies included a director skills matrix in their proxy statements (56% in 2022 compared to 45% in 2021).
See Spencer Stuart’s webpage, which provides access to highlights, industry sector comparisons, and benchmarking results by topic, and its newly released 2022 US Technology Board Index.
Access additional information & resources on our Board Practices/Governance Practices page.
This post first appeared in the weekly Society Alert!